Background
IBM has been a long standing client of Genos, utilizing our emotional intelligence assessment and development programs to help improve coaching and mentoring skills in their managers and the effectiveness of their process improvement personnel. To help further the business case internally, Genos and IBM ran a research project looking at the relationship between leaders’ emotional intelligence and levels of employee engagement among their direct reports.
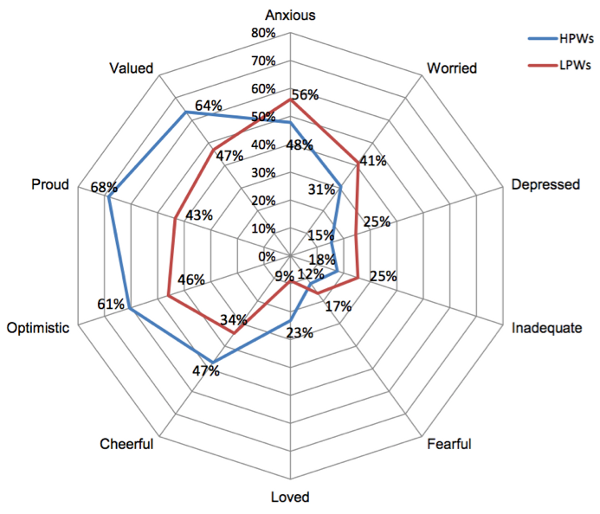
There is a wealth of literature showing that high levels of employee engagement and a greater experience of positive emotions among employees define high-performing workplaces (shown in the graph below).
We proposed that empirical evidence showing a relationship between a leader’s emotional intelligence and employee engagement would help further the business case that this is the key attribute in managers (i.e., their ability to perceive, understand and manage emotions) that helps facilitate a high-performance workforce where people are engaged and have positive emotional experiences.
The Genos Solution
Using the Genos Emotional Intelligence 360-degree Assessment, we assessed the emotional intelligence of over 200 leaders of people within the organisation. Total emotional intelligence scores as rated by others were determined and averaged.
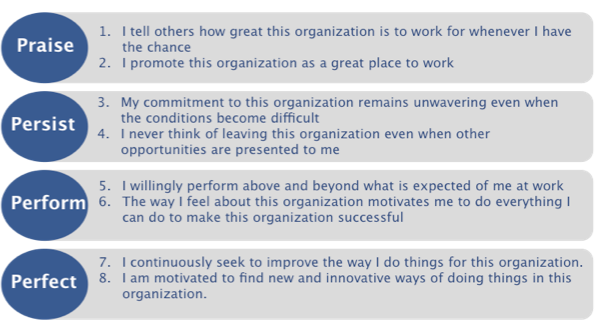
We also assessed the engagement of 438 employees reporting to this leadership group. The Genos Employee Engagement Survey measures an individual’s intellectual and emotional commitment to their work and the organisation. It is measured empirically by asking employees to indicate the extent to which they demonstrate the following four value-creating behaviours (two questions measure each as shown below):
Results
There was a strong positive relationship between leaders’ emotional intelligence and employee engagement. In the graph below, each dot represents an employee’s engagement score. The x axis of the graph represents leaders’ emotional intelligence as a percentile score – scores between 1 and 39 are low, 40 to 59 are average, and 60 and above are high.
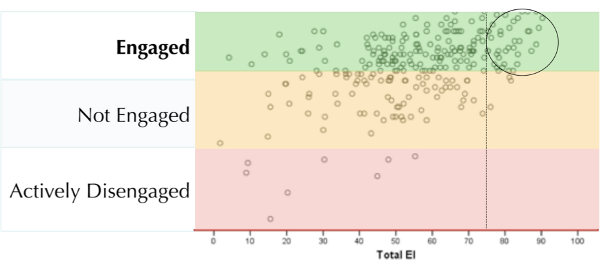
As you can see, being average or low in emotional intelligence results in wide and varying levels of employee engagement where employees are disengaged, not engaged and engaged. These types of engagement scores are typical of low and average performing organisations. Conversely, high levels of emotional intelligence, indeed total emotional intelligence scores above the 75th percentile, result in consistently high engagement scores.
These types of engagement levels among employees are typical of high performance organisations. Indeed, Gallup’s research has shown that organisations with this type of engagement level earn 3.9 times earnings per share greater than like organisations with wide and varied engagement results.
Graph: HPWs = High Performing Workplaces; LPWs = Low Performing Workplaces Boedker, C. et al. (2011). Leadership, culture and management practices of high-performing workplaces in Australia: The high performance workplace index.